
Analytics with FIFA 22
End-to-end Streamlit project beginning with data collecting via web scraping in Beautiful Soup, data cleaning with Pandas, and ending with interactive comparative analysis and visualization tools in Plotly

― Scott Hartley, The Fuzzy and the Techie: Why the Liberal Arts Will Rule the Digital World
End-to-end Streamlit project beginning with data collecting via web scraping in Beautiful Soup, data cleaning with Pandas, and ending with interactive comparative analysis and visualization tools in Plotly
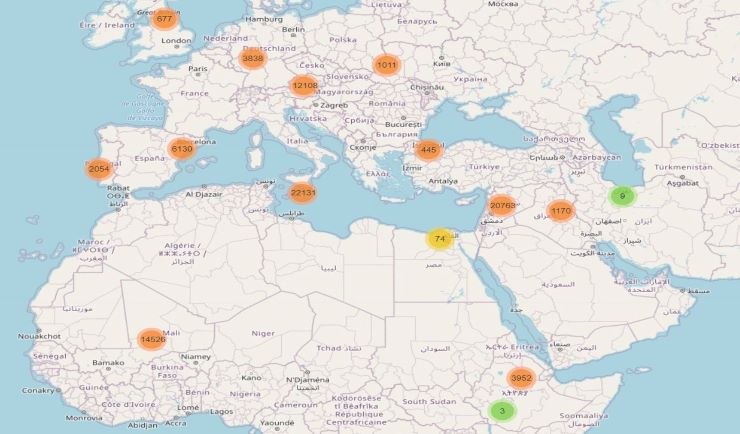
Jupyter/Colab Notebook which visualizes the current location of nearly 100,000 manuscripts catalogued by the Hill Museum.
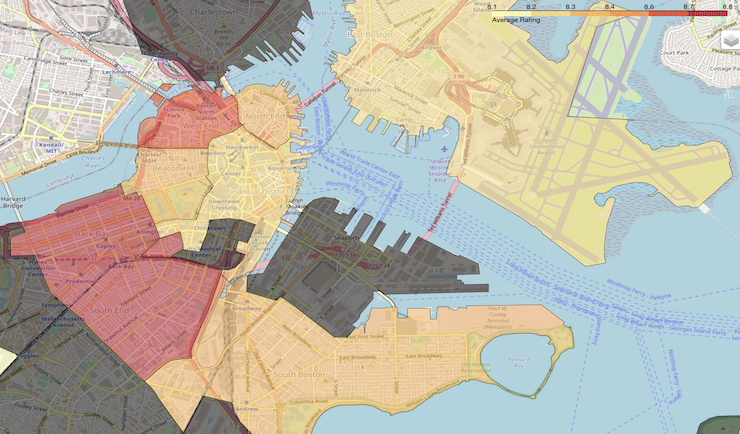
Notebook reviewing location and quality of restraurants with GeoJSON data and Foursquare API.
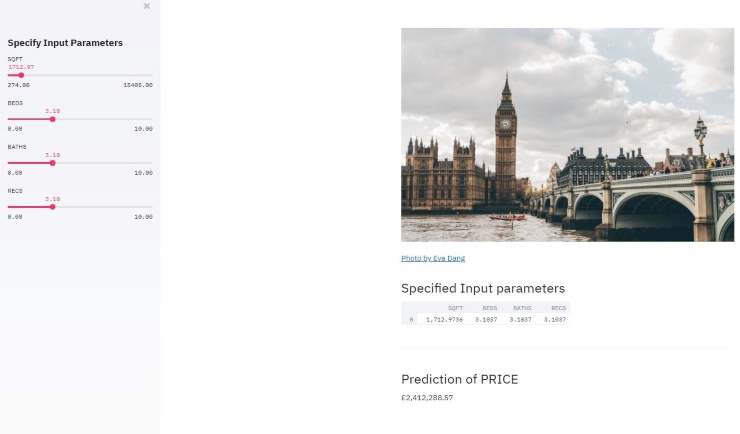
Streamlit application in Python with interactive sidebar.

Practical predictive analytics using Logistic Regression, Decision Trees, Naive Bayes, and K-Nearest Neighbors

Allows users to dream about how much they would have made had they invested in $Doge earlier. Featured on Streamlit's Weekly Roundup